
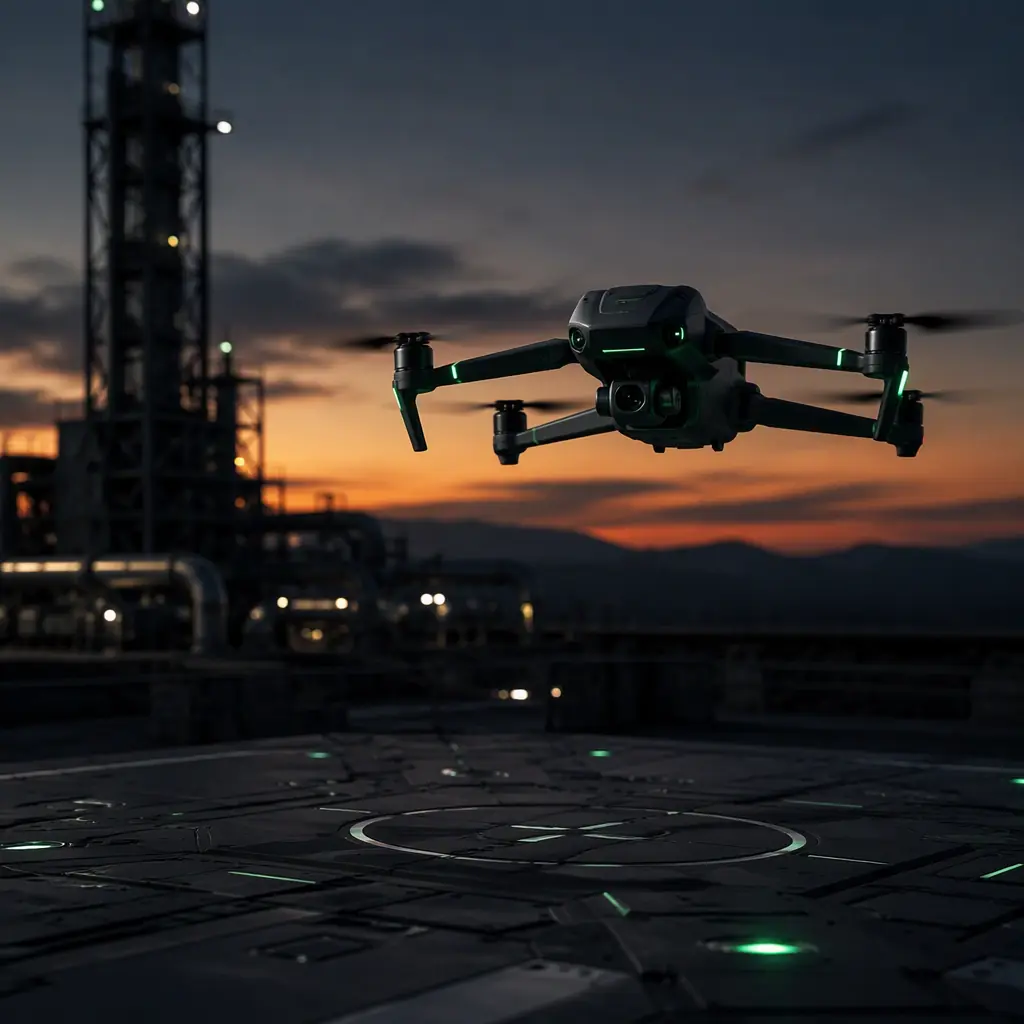
Flight time is a power question, not a battery question. Two aircraft with the same pack will differ in endurance by 40% or more if one drive train converts watts into thrust efficiently and the other does not. The UAV battery and power management guide covers pack chemistry and capacity sizing; this guide shows you how to close the loop between the pack, the drive train and the mission so that the endurance figure on your RFQ is one you can defend.
The endurance equation: usable energy divided by average power
The entire discipline of flight time estimation reduces to one equation:
Flight time (hours) = usable battery energy (Wh) ÷ average power draw (W)
That is it. Every refinement, hover power, cruise power, wind, altitude, temperature, payload, is a correction to one of the two terms. The reason estimates fail is never the equation; it is the inputs. Brochure endurance numbers usually assume the theoretical maximum of both terms: the full rated capacity of the pack and the lowest possible power draw, measured for a few minutes on a test bench. A defensible estimate uses the usable energy (capacity minus the reserve and depth-of-discharge limits your operation actually enforces) and the average power of the real mission profile (climb, cruise, loiter, descent, hover for a sensor pass).
 Hover power
A worked example makes the method concrete. An 8 kg inspection quad with a 6S 16,000 mAh Li-Ion pack (nominal 22.2 V, 355 Wh) flown to 85% depth of discharge carries 302 Wh of usable energy. If its average mission power is 1,120 W, endurance is 302 ÷ 1,120 = 0.27 hours, 16 minutes. Apply a 20% reserve policy and the usable sortie is about 13 minutes. Change any single input, a heavier payload, a windier day, a colder pack, and the answer moves. The point is not that 13 minutes is right or wrong; it is that you can see exactly which assumption is driving the number, and so can your supplier.
Hover power: the first number you need
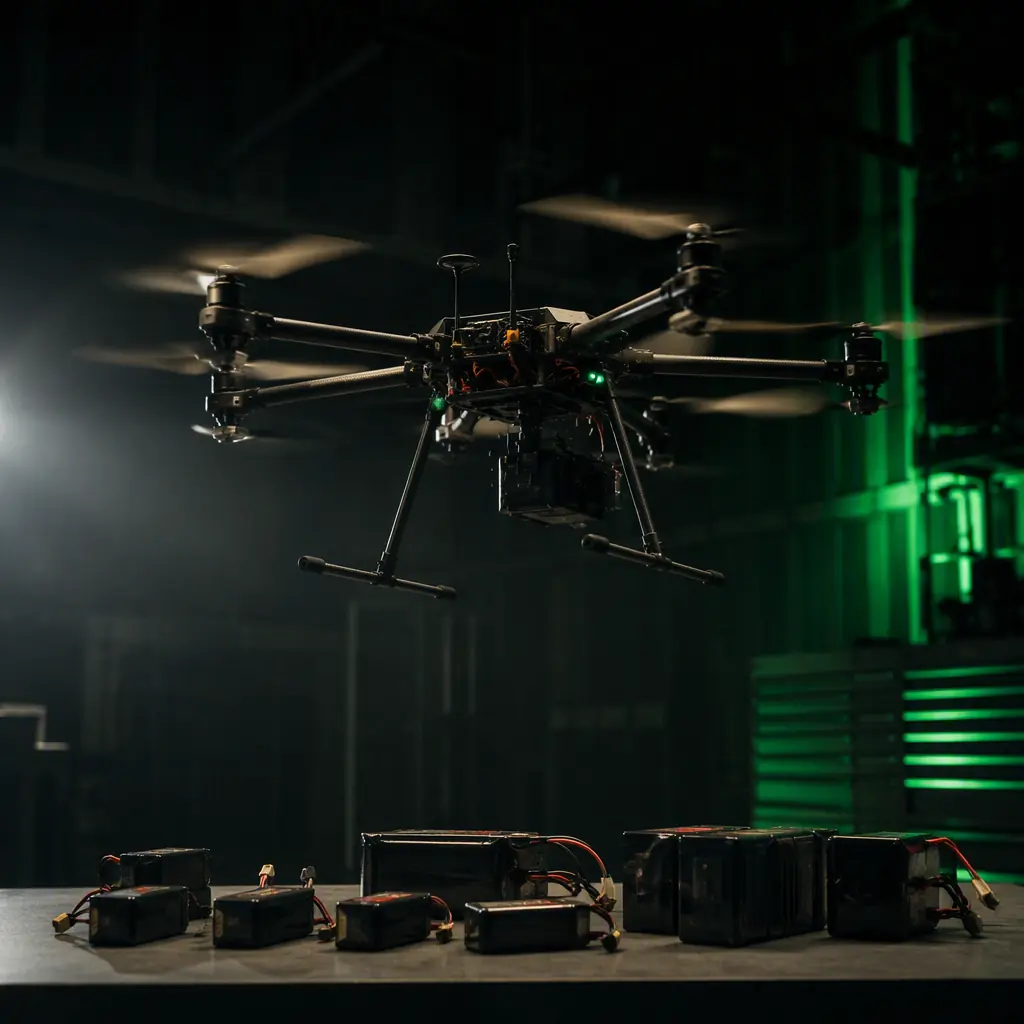
For a multirotor, hover power is the foundation of every endurance estimate, because a quad spends a meaningful share of every mission in or near hover, taking off, landing, holding position over a sensor target, waiting for clearance. Hover power is easiest to reason about as a power density: watts per kilogram of all-up weight.
| Platform class | Typical hover power density | What it means |
|---|---|---|
| Small quad (1-3 kg, 5-9" props) | 220-320 W/kg | High disk loading; short endurance by design |
| Mid inspection quad (5-12 kg, 13-17" props) | 120-180 W/kg | The sweet spot for 20-40 minute missions |
| Heavy-lift hex/octo (20-50 kg) | 100-150 W/kg | Big props and low disk loading win on endurance |
| VTOL fixed-wing, hover phase | 150-220 W/kg | Hover props sized for transition, not endurance |
The range within each class is the drive train's efficiency, prop size, motor KV matching and ESC quality. A 12 kg quad at 130 W/kg draws 1,560 W in hover; the same aircraft with a poorly matched prop set at 170 W/kg draws 2,040 W, 30% more power for the same weight, which cuts endurance by a corresponding 30%. The powertrain matching guide explains how thrust curves and thermal limits decide which side of that range your build lands on, and the heavy-lift propulsion design guide shows the disk-loading trade-off at the top of the weight scale.
Cruise and transition power: multirotor vs fixed-wing vs VTOL
Hover power alone is only the full answer for a platform that never translates. Real missions spend time in forward flight, and the power profile changes with airframe type:
- Multirotor cruise. Forward flight at moderate speed reduces induced power, so cruise power typically runs 15-30% below hover power, but only up to the speed where parasitic drag starts to dominate. The minimum-power speed is usually 8-14 m/s for a mid-size quad, and flying faster than it burns more, not less.
- Fixed-wing cruise. A fixed-wing converts lift from wings instead of thrust, so cruise power density is dramatically lower, commonly 60-100 W/kg against 120-180 W/kg hover for the same size class. That is why the multirotor vs fixed-wing guide exists: the airframe decision is an endurance decision.
- VTOL transition. A VTOL aircraft pays a transition penalty every flight: the hover phase burns at 150-220 W/kg while the cruise phase burns at a fraction of that. The endurance estimate must weight each phase by its duration, and the transition itself, covered in the VTOL transition components guide . Is where thrust margin and control authority get consumed.
The practical consequence: ask for the power draw at the mission's actual speeds and phases, not one headline number. A mapping operator flying 70% of the sortie in fixed-wing cruise gets a very different answer than an inspection operator hovering over 40 structures in a row.
Payload, wind, altitude and temperature: derating the average
Once you have a clean power figure for the bare aircraft, apply the four derating factors that separate lab endurance from field endurance:
- Payload. Every kilogram of payload raises the power draw in the same proportion as raising the aircraft weight, the power density applies to the total. The same 8 kg quad carrying a 2 kg gimbal and sensor becomes a 10 kg quad: at 140 W/kg, hover power rises from 1,120 W to 1,400 W, and the 302 Wh usable pack drops from 16 to 13 minutes. The payload power budgeting guide shows how to budget the sensor side of that equation.
- Wind. A steady 5 m/s wind typically adds 10-20% to average mission power on a small quad, because the aircraft must fly into it half the time and correct for drift the rest. At 10 m/s, plan for 30-50% more average power, and check the aircraft's rated wind limit before the mission exists on paper.
- Altitude. Air density at 3,000 m is roughly 74% of sea level. Since induced power scales inversely with the square root of air density, a hover at 3,000 m needs about 15-20% more power than the same hover at sea level, before any effect on motor cooling or propeller performance. High-altitude missions (mountain inspection, alpine mapping) need an altitude-corrected estimate, not a sea-level one.
- Temperature. A Li-Ion pack at 0 °C delivers roughly 10-20% less usable capacity than at 25 °C and sags harder under load, which can trip low-voltage cutoffs earlier than the estimate predicts. Cold-weather endurance planning should derate capacity and add reserve; the thermal management for UAV electronics guide covers the component side of the same problem.
 Mission derating
The derating factors multiply, not add. A 10 kg aircraft with payload, flying into 5 m/s wind at 2,000 m in 0 °C weather is carrying a 1.1 × 1.15 × 1.1 ≈ 1.4 multiplier on bare-aircraft power before the reserve policy is applied. Estimates that ignore the multiplier are how 40-minute brochure aircraft become 18-minute operational aircraft.
Battery side: capacity, usable energy and the discharge-rate trap
The energy term of the equation has its own traps. Rated capacity is not usable energy:
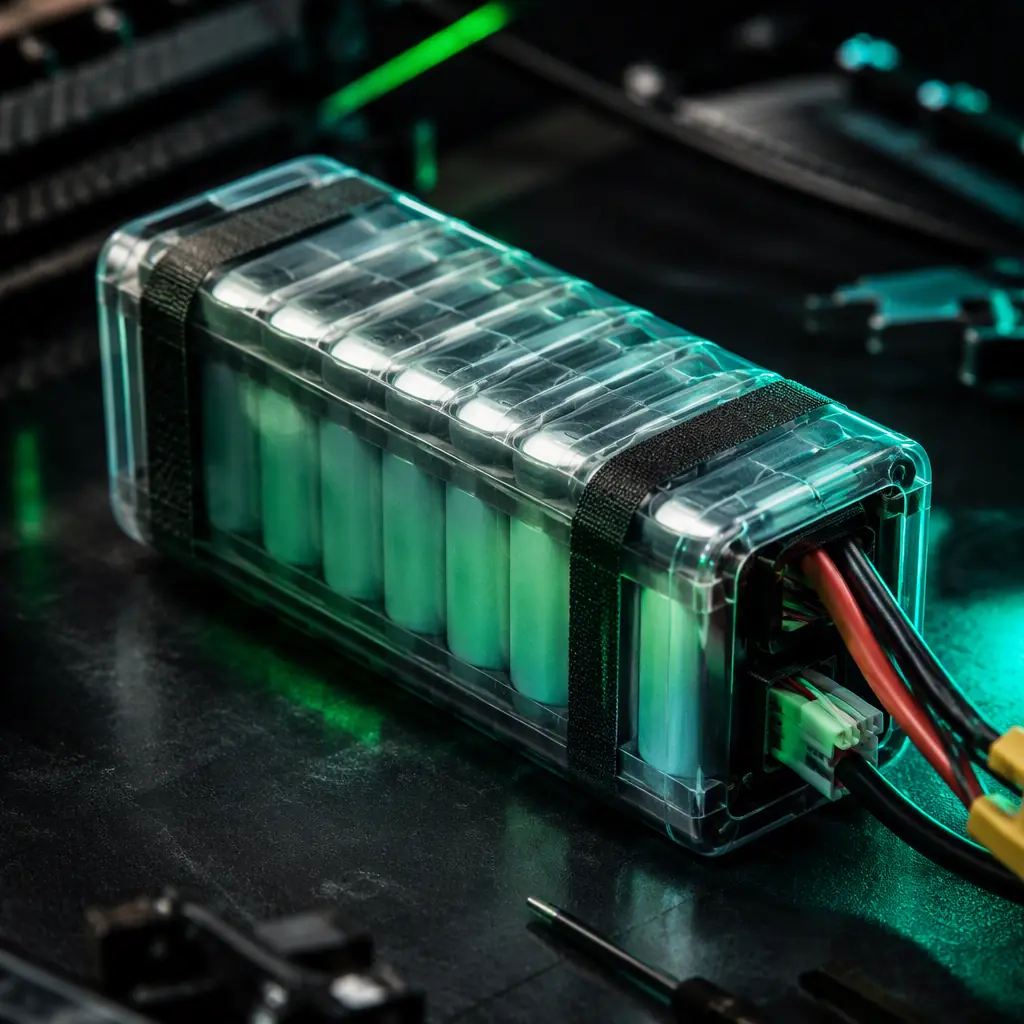
- Depth of discharge. The 355 Wh pack in the example above is only 302 Wh usable at 85% DoD. The remaining 15% protects cycle life. A Li-Ion pack cycled to 80% DoD instead of 100% roughly doubles its cycles to 80% capacity retention, which is why the spares and lifecycle planning guide treats DoD policy as a fleet-cost lever, not a convenience.
- Discharge-rate trap. A pack's rated capacity is measured at a low discharge rate. Draw it at high C-rate and delivered capacity falls, a 16,000 mAh Li-Ion pack drawn at 3C may deliver 85-92% of rated capacity before the voltage sag hits the cutoff. The motor KV selection guide and the battery guide both cover how current draw per cell scales with drive-train choices; the endurance consequence is that high-draw configurations need a capacity derate in the estimate.
- Reserve policy. Civil aviation rules of thumb carry 20-30% reserve; UAV operations should carry at least 20% against wind, sensors, holds and the fuel-gauge error that appears near empty. Reserve is not an efficiency loss. It is the difference between a routine landing and a forced landing off-site.
 Usable energy
If the endurance target is fixed and the estimate comes up short, the options are exactly the ones the equation exposes: more usable energy (bigger or higher-energy pack, within the airframe's weight budget), less average power (propulsion efficiency, cruise profile, lighter payload), or a more aggressive, and defensible, reserve policy. There is no fourth option, and anyone offering one is selling brochure numbers.
The efficiency chain: prop, motor and ESC move the answer
The average power term is where component quality shows up, and it is the term you control at specification time. The drive train converts battery watts into thrust through three stages, each with its own efficiency:
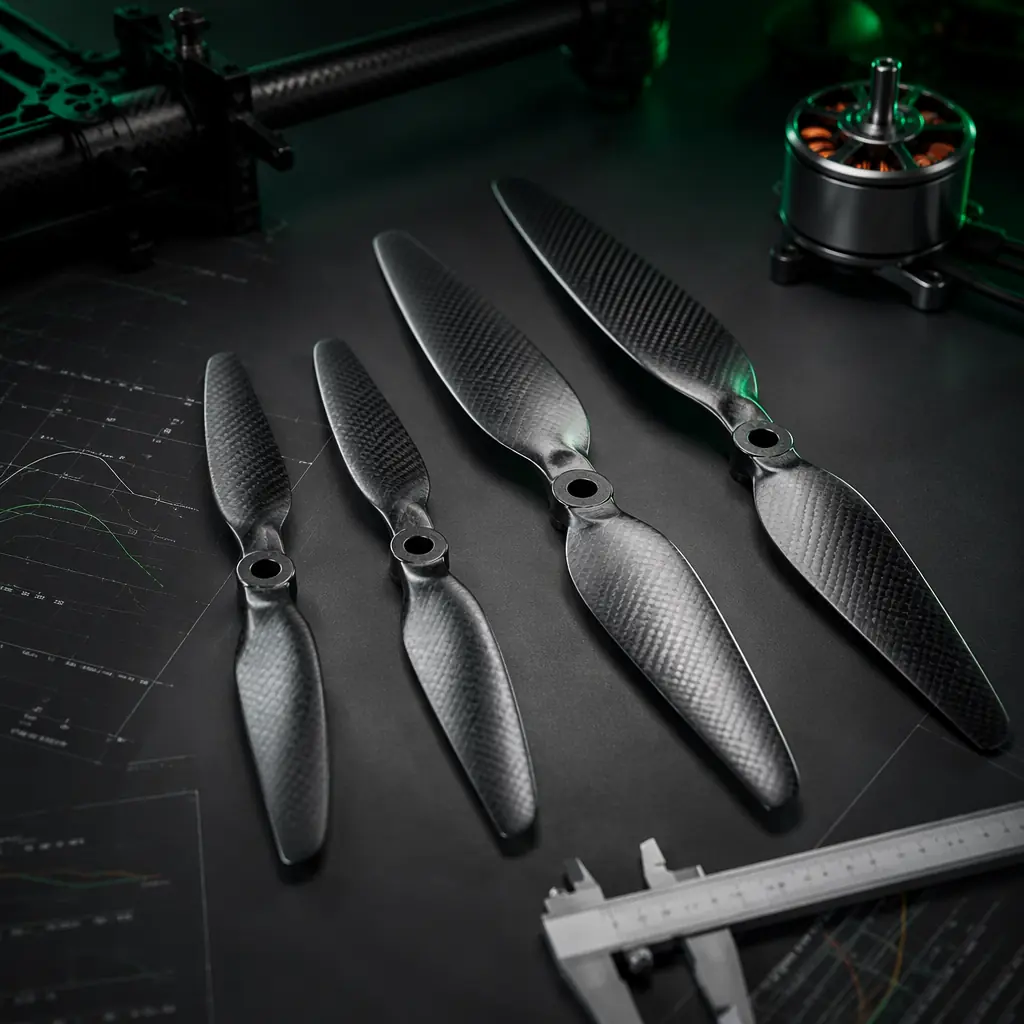
- Propeller. A well-matched prop converts 60-75% of shaft power into useful thrust in hover. Diameter and pitch decide the operating point: a larger diameter at the same pitch loads the motor differently and generally improves static efficiency, which is why the propeller selection guide is the first stop when endurance is the goal. A prop that is too small or pitched for speed will burn 10-20% more power in hover for the same thrust.
- Motor. Brushless motors peak at 80-90% efficiency, but only near their optimal load point. A motor running at 40% of its rated torque is well outside that window; the motor KV selection guide covers matching KV and size to the prop and target power. An oversized motor adds weight and runs inefficient; an undersized one runs hot and loses efficiency under load.
- ESC. Modern ESCs lose 2-5% as switching and conduction loss, and the choice matters at the margin. The ESC firmware guide compares BLHeli_32, AM32 and FOC control schemes, whose commutation efficiency differs most at partial throttle, exactly where endurance missions fly.
Three percent of drive-train efficiency on an aircraft drawing 1,200 W is 36 W of continuous savings. On a 302 Wh usable pack, that is roughly 5% more flight time for free, before the weight savings of a lighter drive train are counted. Efficiency is not a marketing adjective; it is the endurance term you can actually buy.
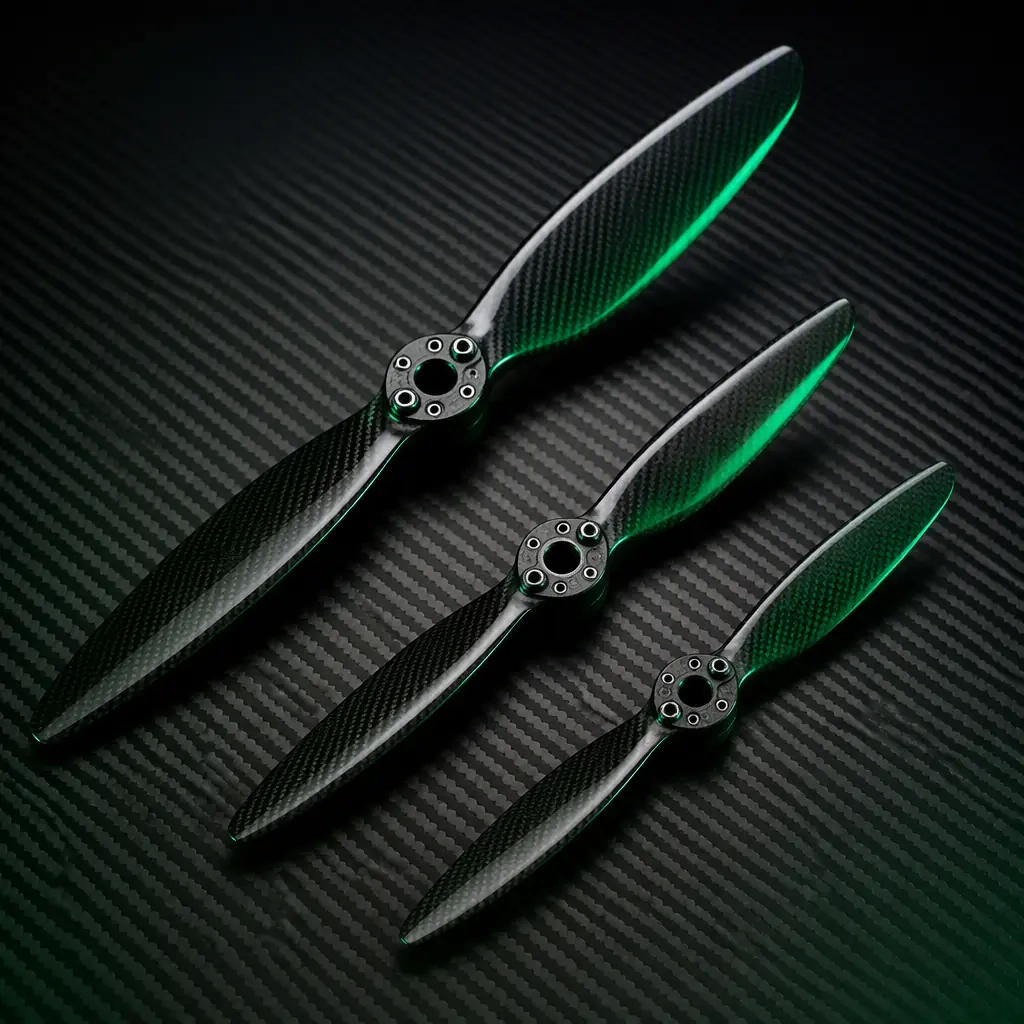 Propulsion efficiency
From estimate to specification: demanding validated power data
Every number in this guide is an estimate until it is measured. The difference between a credible supplier and a brochure supplier is whether the power figures come from a thrust stand or a spreadsheet:
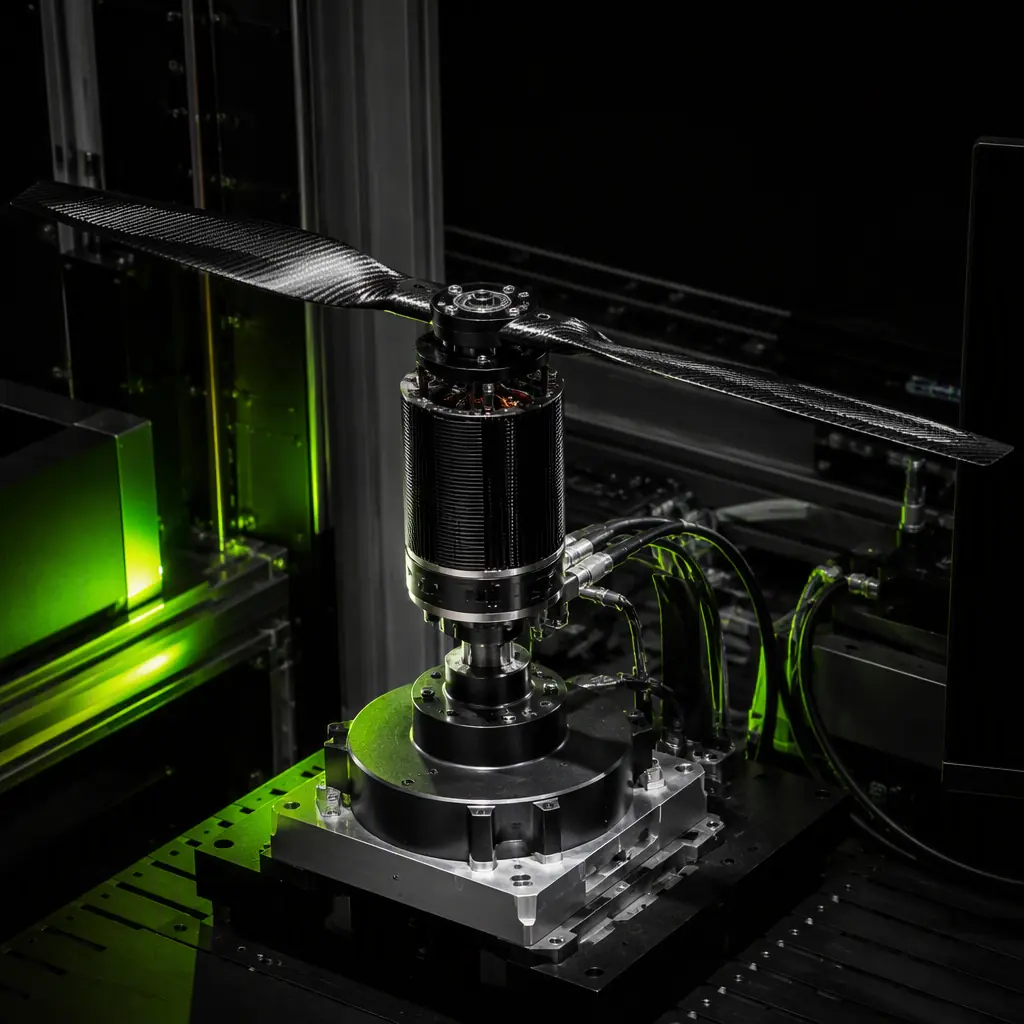
- Thrust-stand data. A propulsion test report should show thrust, current, voltage and efficiency across the throttle range, not a single best-case point. The propulsion testing and validation guide explains how to read those curves and what a matched thrust curve looks like when the prop, motor and ESC are coherent.
- Endurance defined by mission profile. Ask for endurance at your profile: payload mass, cruise speed, hover share, wind derate. If the supplier answers with one number and no assumptions, the number is a marketing artifact.
- Thermal reality. Sustained power draw is limited by motor and ESC thermal limits, not just electrical ratings. A system that holds hover power for 30 minutes without derating is a different product from one that throttles down after 10. Thermal test data belongs in the report.
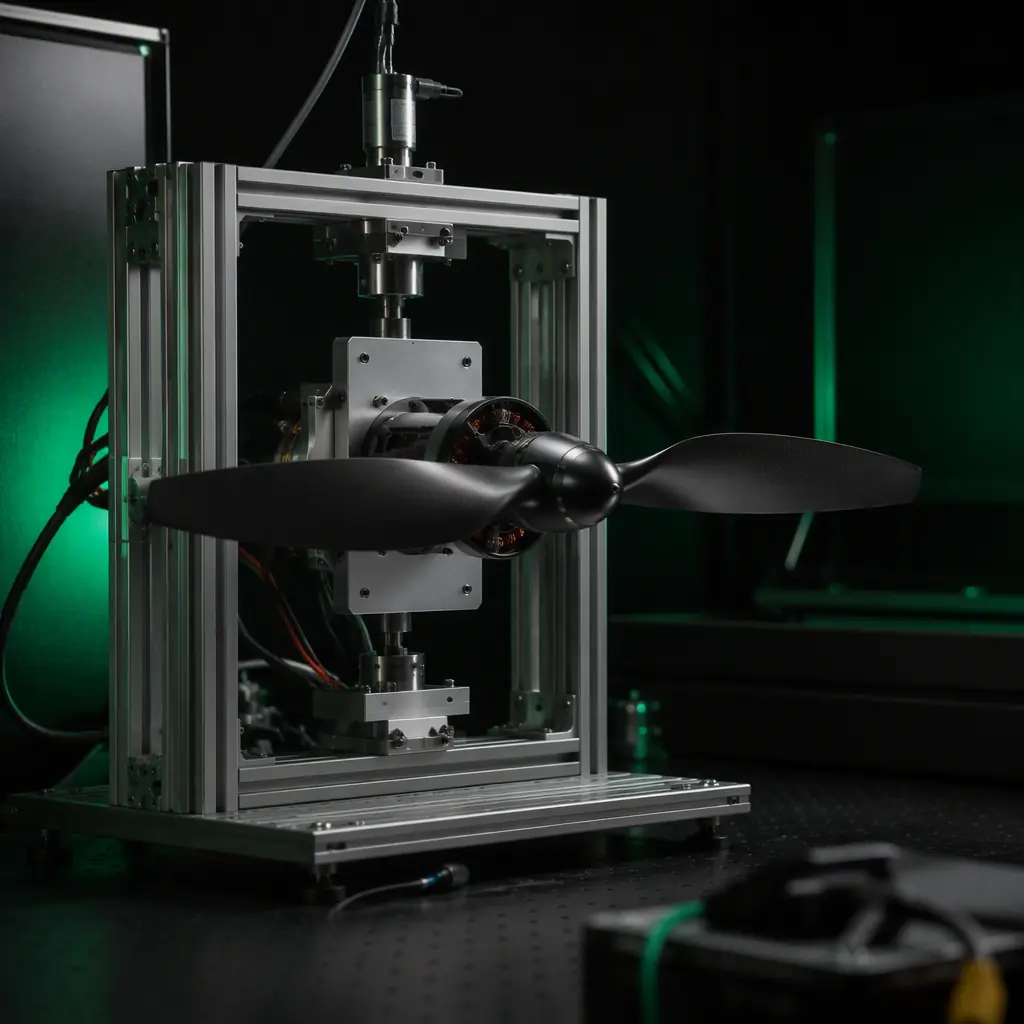 Thrust-stand validation
EMS Drone tests every matched propulsion system on a thrust stand before shipment. Thrust curves, current draw and thermal performance are part of the delivered documentation, so the endurance estimate in your spec is built on measured data, not assumptions. Send us the mission profile and we will return the power budget, the endurance calculation and the propulsion test report that supports it.
Flight time procurement checklist
- Equation first. Write the endurance target and the equation, usable Wh ÷ average W, before talking to any supplier, so the conversation is about assumptions, not magic.
- Power density. Confirm the hover and cruise power densities (W/kg) for your platform class and your payload, and ask which measured data they come from.
- Mission profile. Define payload mass, speed, hover share, wind and altitude assumptions in writing; the estimate is only as good as the profile.
- Usable energy. Specify DoD policy and reserve (e.g. 85% DoD, 20% reserve) so the pack capacity quoted is the usable capacity.
- Derating. Apply the multiplier for payload, wind, altitude and temperature; verify the result still meets the mission minimum.
- Test data. Demand a propulsion test report, thrust, current, efficiency and thermal across the throttle range, with the endurance claim.
- Efficiency chain. Check that prop, motor and ESC are matched at the endurance operating point, not at peak thrust.
The bottom line: flight time is the ratio of two numbers you can verify, usable battery energy and average mission power. Estimate both honestly, apply the derating factors and reserve policy, and the endurance figure in your RFQ becomes a requirement you can test instead of a hope you can argue about. EMS Drone specifies and tests complete propulsion chains, battery, ESC, motor and prop as one matched system, so the endurance you plan is the endurance you get. Send your mission profile and target endurance, and we will respond with the power budget, the matched component list and the test report.
Explore Propulsion Back to Blog
Continue Reading
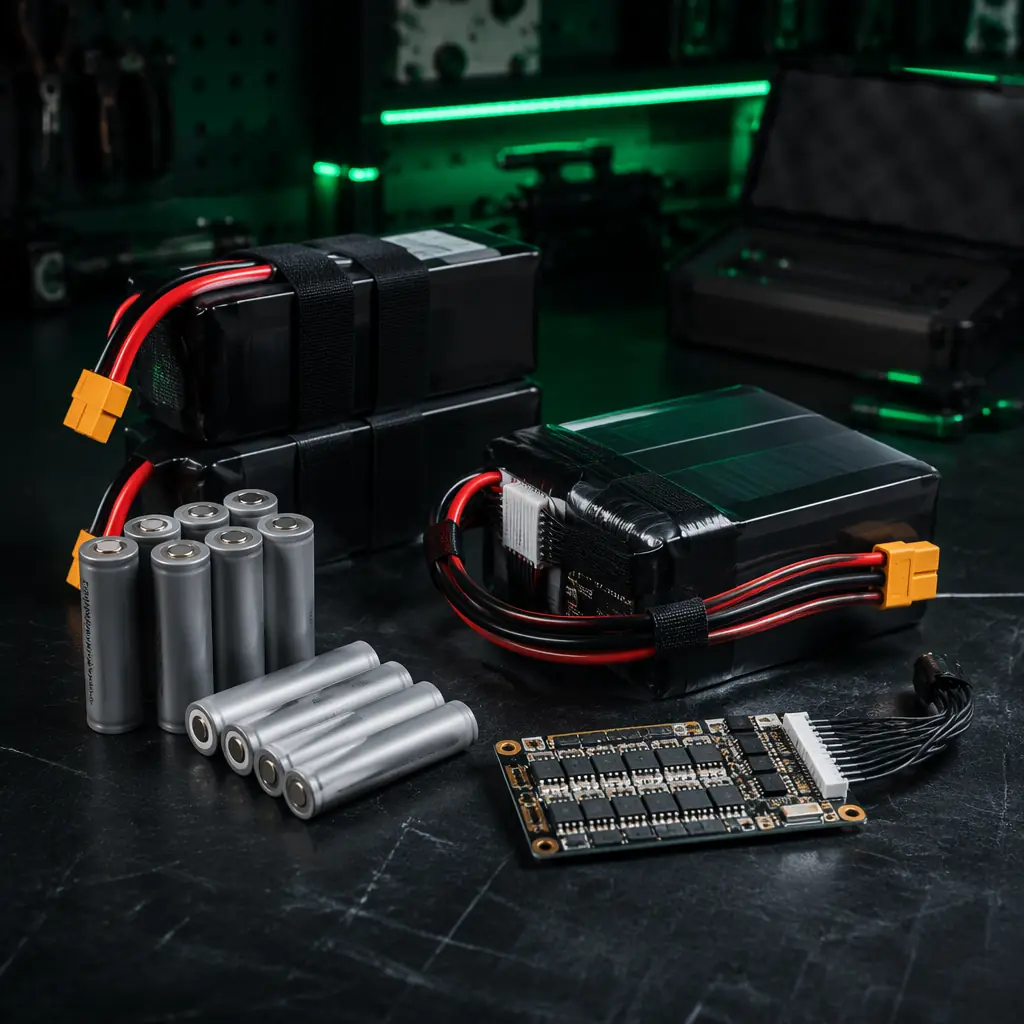
Battery & Power Management
The LiPo vs Li-Ion trade-offs and the capacity-sizing logic behind the energy term.
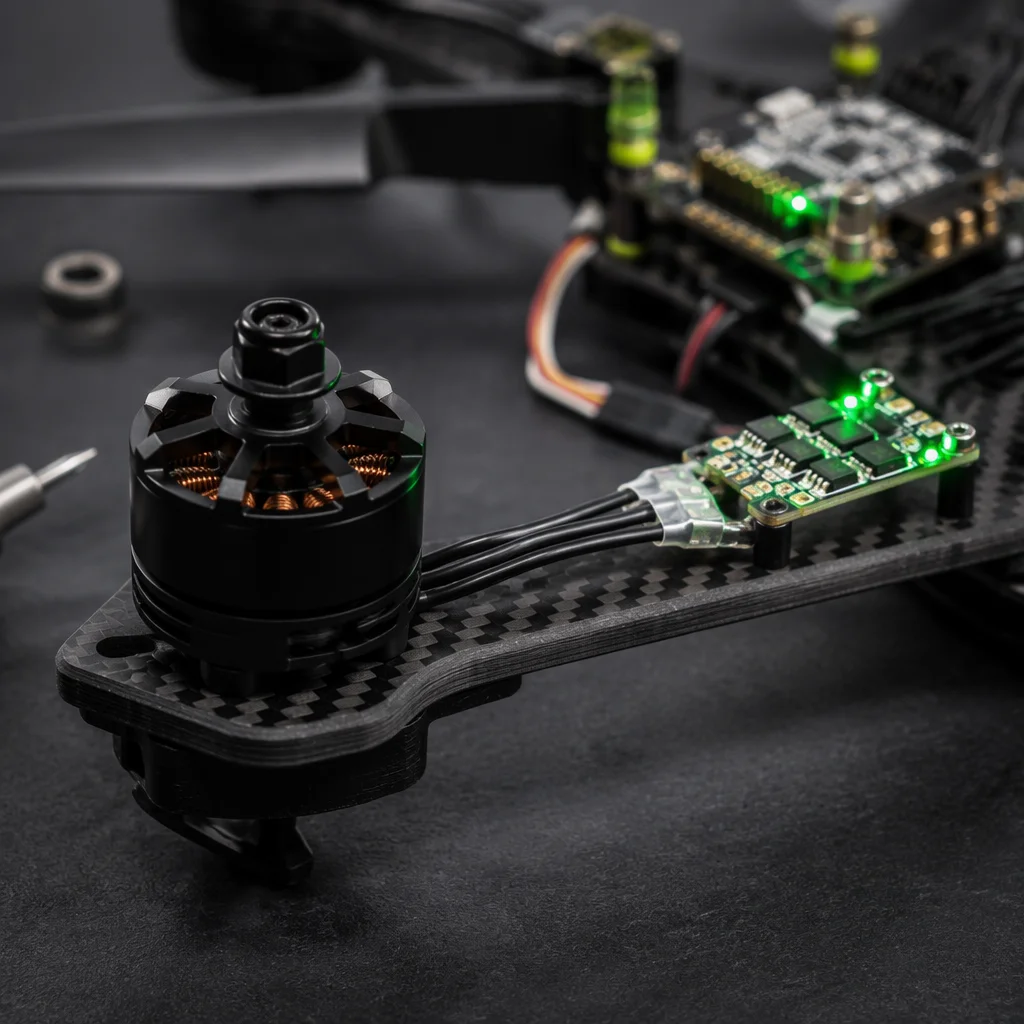
Powertrain Matching
How FC, ESC and motor matching decides which side of the power range you land on.
Propeller Selection
Diameter and pitch decisions that move hover efficiency and endurance.
Payload Power Budgeting
Budgeting the sensor side of the average power term.
Propulsion Testing
Reading thrust-stand curves so the endurance claim is measured, not guessed.