

Spares planning sits at the intersection of reliability engineering and procurement, and most UAV buyers arrive at it reactively — after the first crash, the first shipping delay, or the first component that quietly went end-of-life. The reactive path is expensive in three currencies: money (expedited freight and single-unit pricing), time (aircraft on the ground while a part transits the border), and engineering attention (the team re-solving the same logistics problem every month). The alternative is a small, deliberate planning exercise at RFQ time that this article walks through end to end. It pairs with the UAV component obsolescence management guide, which covers what happens when a part is discontinued; this guide covers the inventory and reliability planning that keeps the aircraft flying between those events.
Why spares planning starts at the RFQ, not after a crash
The planning window that matters is the procurement window. Once the aircraft is delivered, every spares decision is made under time pressure and at retail prices; before the order is placed, spares ride the same production line, the same test program and the same freight consolidation as the aircraft itself. A spare flight controller sourced with the aircraft costs a fraction of one sourced six months later, and it arrives with the same firmware, the same calibration records and the same traceability batch — the exact reasons an emergency replacement is risky. The UAV component supplier evaluation checklist covers the vendor side of this relationship: the supplier's ability to quote spares with the original build, hold long-term availability commitments, and publish the reliability data that spares math needs.
The RFQ should therefore carry a spares line item with the same rigor as the flight-critical components. It does not need to be large — for a single-aircraft program the initial spares buy is typically 8–15% of the aircraft value — but it needs to be specified, priced and documented before the order, not improvised after it. The rest of this guide is the method for deciding what goes in that line item.
MTBF: the reliability number that drives the spares calculation
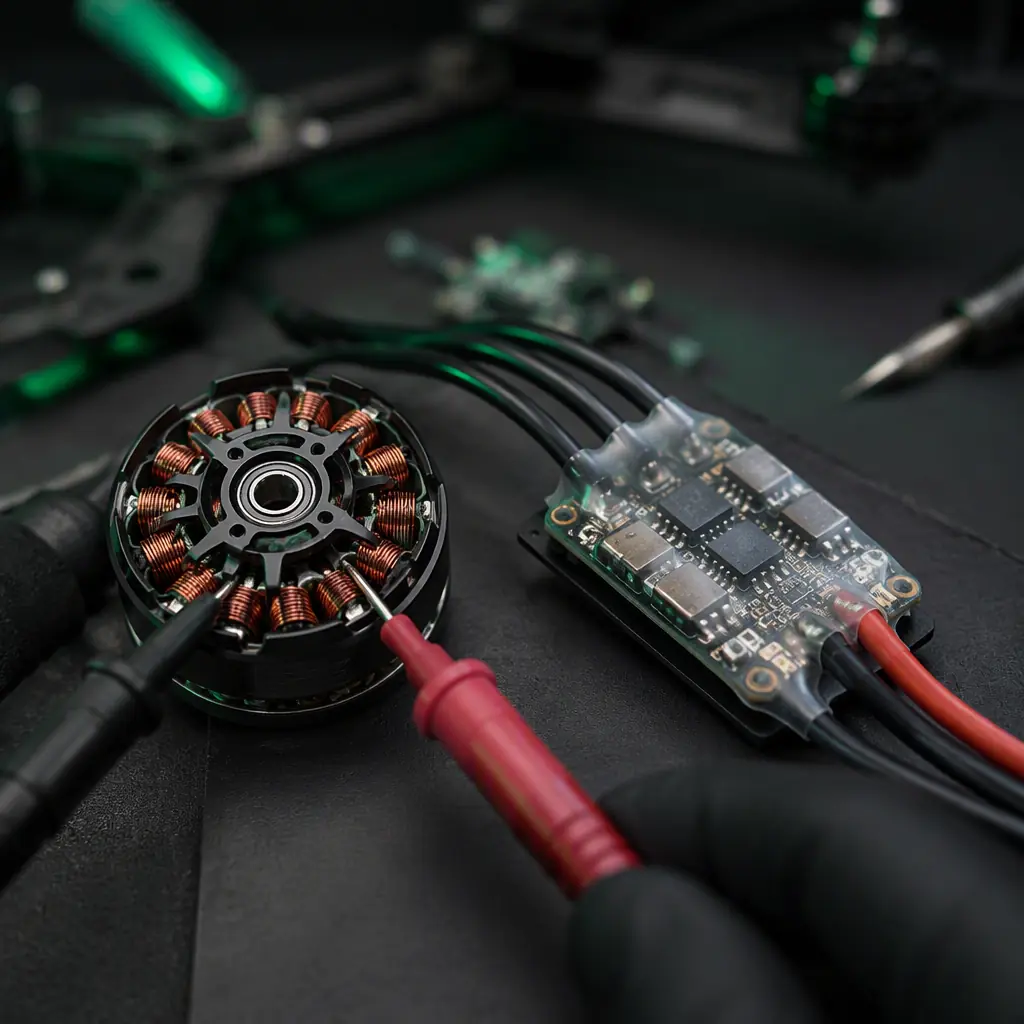
Spares math starts from failure rate, and the unit that vendors publish is MTBF (mean time between failures). The relationship that matters for planning is deceptively simple: for a component with MTBF of M hours, operating t hours per year, the expected annual failures are roughly t ÷ M. A flight controller rated at 20,000 hours MTBF, flown 500 hours per year, expects 0.025 failures per year — one failure every 40 years, which suggests you do not need a spare. That conclusion is wrong, and the error is instructive.
Why published MTBF underestimates field failures. First, MTBF is a statistical mean, not a guarantee: a component with 20,000 hours MTBF still has roughly a 5% chance of failing within its first 1,000 hours. Second, published MTBF is usually calculated under benign conditions — controlled temperature, clean power, no vibration — while a UAV electronics bay operates at 40–70°C with 5–500 Hz vibration and battery-rail transients. The UAV electronics manufacturing quality guide explains the IPC-A-610 and J-STD-001 workmanship variables that shift real failure rates by an order of magnitude; the planning takeaway is to derate vendor MTBF by 3–10× depending on the operating environment. Third, the bathtub curve matters: electronics fail more often in early life (infant mortality, weeded out by burn-in) and late life (wear-out mechanisms), and the mission profile decides which region the fleet is in. The UAV propulsion testing and validation guide documents the bench-test programs that catch infant mortality before the aircraft ships — which is exactly why a spares strategy should prefer suppliers who test, not just assemble.
The practical planning number is not the single MTBF figure but the fleet failure rate per operating hour per subsystem, derived from the supplier's data, derated for environment, and validated against the first six months of operations. That number feeds the spares sizing equation in the next section.
 Concept illustration
Sizing the spare kit: the math that sets inventory levels
With a failure rate per subsystem, the kit sizes itself. The governing equation is the Poisson probability of needing n or more units of a line item within the resupply lead time: if a component fails at rate λ per year and resupply takes L months, the expected demand during the lead-time window is λ × L ÷ 12. For a motor that fails at 0.8 per year with a 6-month resupply window, expected demand is 0.4 units; stocking two spares covers 96% of scenarios, stocking one covers 67% — the Poisson distribution is the honest way to make that call instead of guessing.
The 80/20 reality of UAV failures. Field data across industrial programs concentrates roughly 80% of unscheduled downtime in a small set of line items, and for multirotor platforms the list is remarkably consistent:
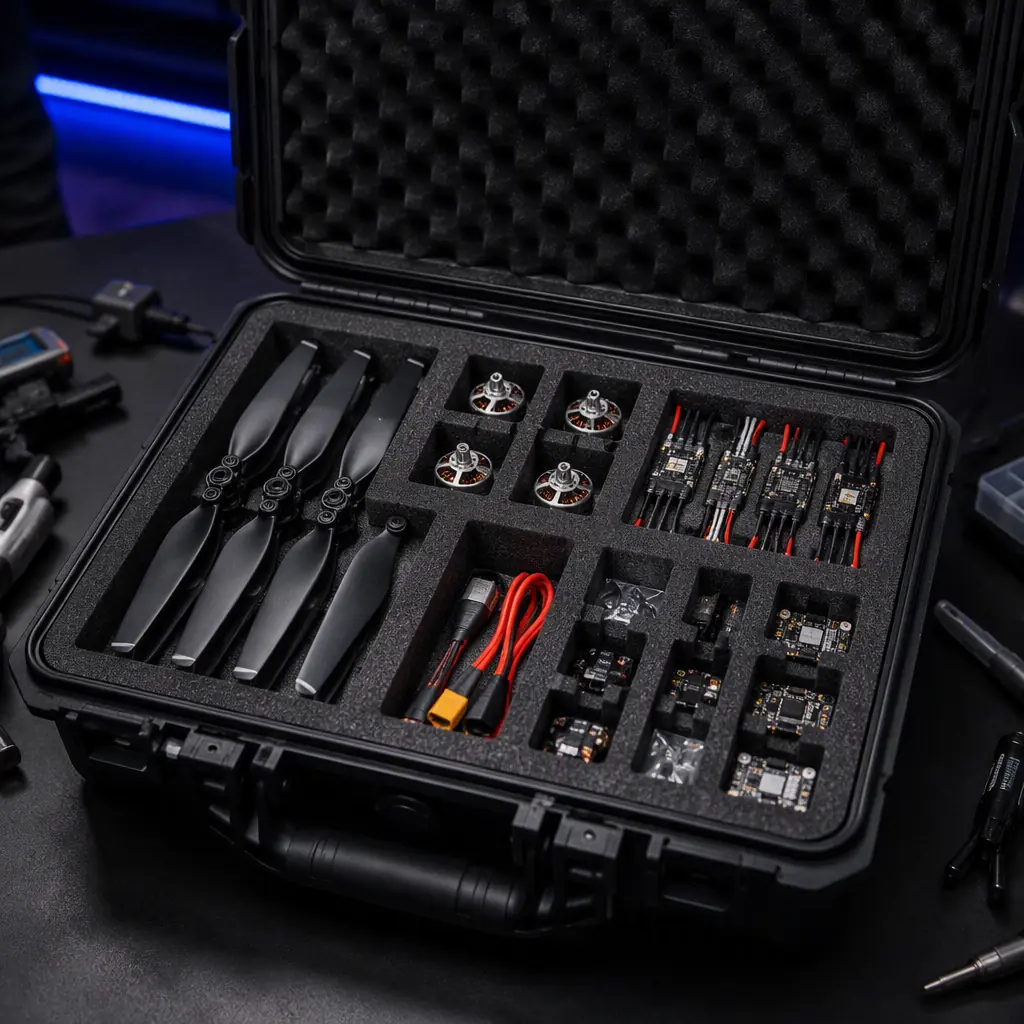
- Propellers and prop hardware. The highest-consumption line item on any multirotor — a heavy inspection aircraft can wear out a set of propellers every 50–150 flight hours, and every hard landing or tip-over claims at least one. Stocking ratio: 2–4 full sets per aircraft.
- Motors (bearings and shafts). Bearing wear is the dominant failure mode; a motor with a bent shaft is not repairable in the field. Stocking ratio: 1–2 per aircraft for single-motor-per-arm configs.
- ESCs. The power electronics fail from thermal cycling and voltage transients rather than wear; a spare ESC must match the exact firmware and protocol configuration, so it belongs in the initial buy. The ESC firmware selection guide explains why firmware revision is a compatibility constraint, not a preference.
- Flight controller and GPS/compass modules. Low failure rate but long resupply lead time, so at least one spare each for a single-aircraft operation.
- Batteries. Treated separately below — they are a consumable with a cycle-life limit, not a failure-replacement item.
- Structural items that absorb impact. Landing gear, arm-end caps, quick-release mounts — cheap, slow to ship, and the first thing damaged in any incident.
The 20% that still deserves a line. The remaining items (telemetry radios, gimbal, payload interfaces, wiring harnesses) fail less often, but their failure is often mission-terminating for the day. The rule: any component whose failure grounds the aircraft and whose resupply lead time exceeds the mission schedule tolerance belongs in the kit, even at one unit.
The kit then needs a rotating-repair loop: a spare is not inventory, it is a buffer while the failed unit goes through diagnosis and repair. The UAV safety and redundancy systems guide covers the design-side version of the same logic — redundant channels on the aircraft reduce the consequence of a single failure; the spares loop reduces the downtime that follows it.
 Concept illustration
Repairable vs consumable: two pipelines, two budgets
The kit splits into two logistics pipelines with different economics. Repairables — flight controllers, ESCs, gimbals, radio modules — are high-value items where the failed unit goes back to the manufacturer or a qualified repair center, and the spare covers the turnaround time. The planning variable is repair turnaround (typically 2–6 weeks including international freight), which directly sets how many spares the fleet needs. A repair that takes 6 weeks and a failure rate of 0.5/year means the aircraft can be grounded for up to 6 weeks if the fleet carries one spare — the availability target (for example, 95% aircraft availability) is what converts turnaround time into inventory quantity.
Consumables — propellers, bearings, filters, adhesives, fasteners — are replaced and discarded, and their planning variable is consumption rate, not MTBF. Propeller consumption tracks flight hours and landing style; battery consumption tracks cycle count; neither is a failure event. Consumables belong in a standing replenishment order with a reorder point, not a one-time kit. The UAV fleet management components guide covers the telemetry and tracking side of the same operation — the maintenance-logging infrastructure that turns flight hours and cycle counts into actual consumption data, which is the only reliable basis for reorder points.
One distinction matters for the RFQ: the repairability of each line item is a procurement term, not an assumption. The RFQ should state the expected repair scope (board-level, module-level or factory-only), the repair turnaround commitment, and the repair-versus-replace cost threshold — the percentage of new-unit price above which repair no longer makes economic sense. A flight controller with a repair threshold of 60% of new price and a 4-week turnaround is a very different planning asset than one repaired only at the factory at 90% of new price.
Battery and consumable lifecycle: cycle count, storage and retirement
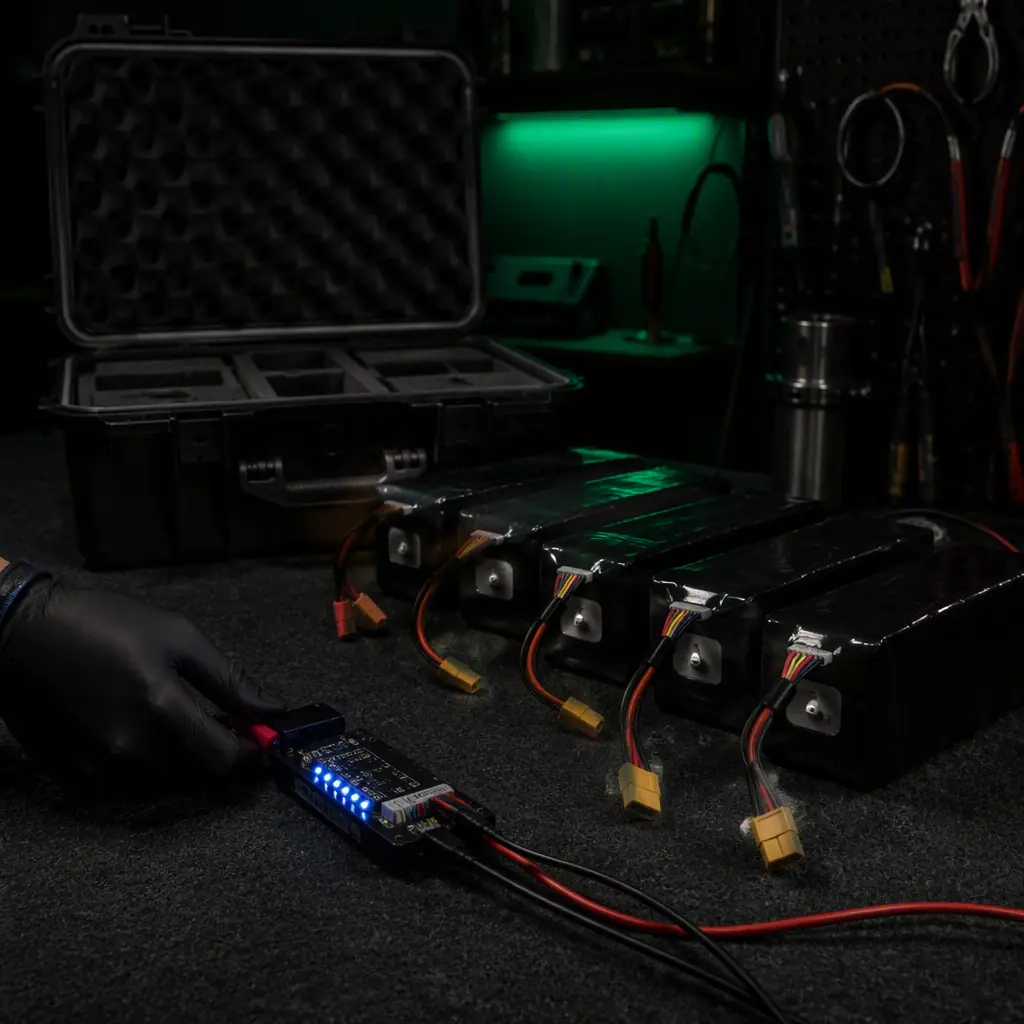
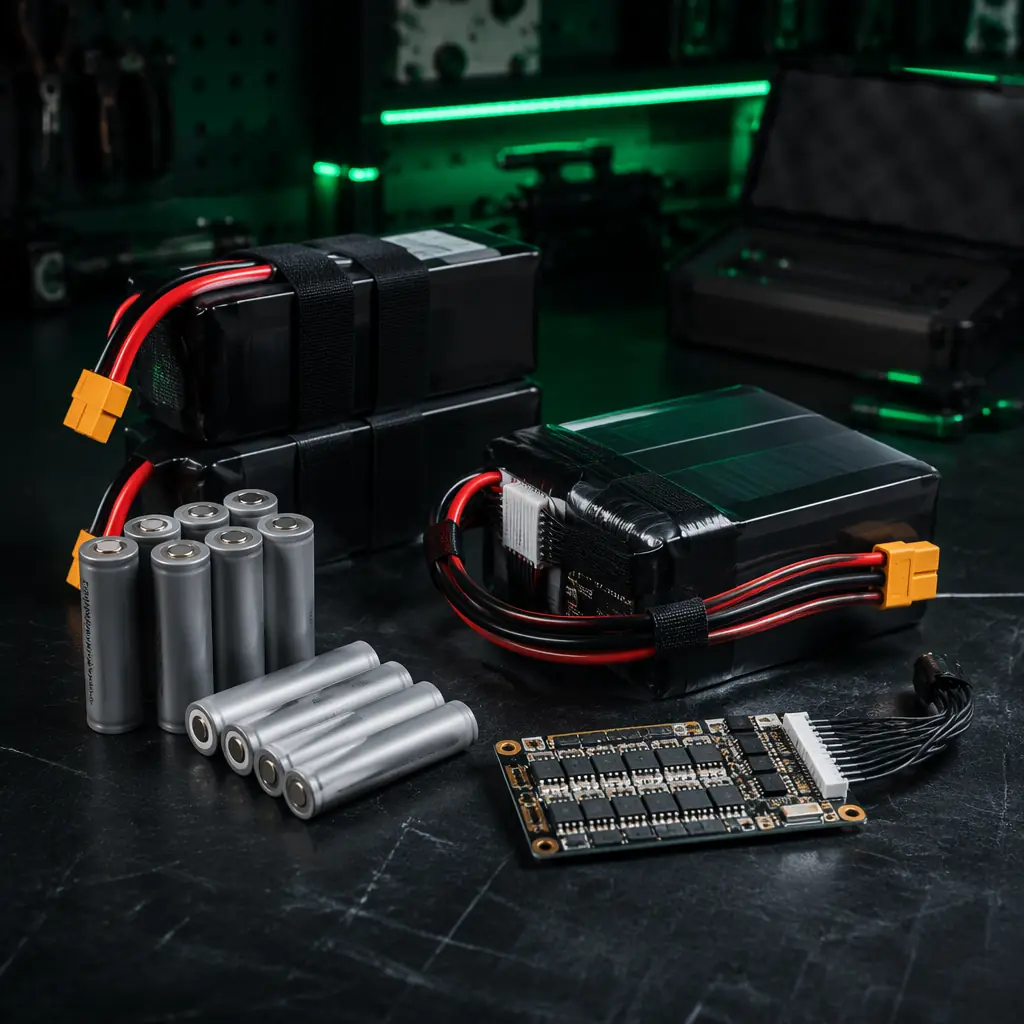
LiPo and Li-Ion packs are the only components on the aircraft with a hard calendar life independent of failures. A LiPo pack's cycle life is typically 150–300 cycles at full depth of discharge, and calendar aging continues even when the pack sits unused: at 25°C a LiPo stored at full charge loses roughly 20% of capacity in 12 months, while a pack stored at 3.8 V/cell loses roughly 4%. The UAV battery and power management guide covers cell chemistry selection and the BMS side; the lifecycle planning side is the discipline that turns that knowledge into inventory policy:
- Cycle budgeting. A fleet flying 500 hours per year with 20-minute flights cycles about 1,500 flights per aircraft per year. At 200 cycles per pack with 3 packs in rotation, that is roughly 8 packs per aircraft per year in consumption — the number the operations budget should plan for, and the number that tells you when to buy.
- Storage discipline. Spare packs stored at storage voltage (3.8–3.85 V/cell for LiPo, ~50–60% state of charge for Li-Ion) in a fire-rated container, rechecked every 60–90 days. A pack that sits at full charge on a shelf is aging at the worst possible rate.
- Retirement criteria. The pack is retired when capacity drops below ~80% of rated, internal resistance rises beyond the propulsion requirement, or any cell shows voltage divergence under load. Retired packs are a disposal logistics item — the UAV export logistics and ITAR/EAR shipping guide covers why lithium batteries are one of the most regulated items in international freight, which is exactly why they belong in the initial spares buy rather than emergency airfreight.
Consumables follow the same calendar discipline: propellers degrade in UV and shed strength with flight hours even without visible damage, and a common industrial policy replaces props on a fixed interval (for example, every 100 flight hours or after any hard landing) rather than on visible wear.
 Concept illustration
Storage and preservation: how components age on the shelf
A spare part is only useful if it still works when opened, and electronics age on the shelf faster than most buyers expect. The dominant mechanisms are humidity, temperature cycling, and corrosion of exposed contacts. The storage specification for a UAV spares kit is short but non-negotiable:
- Sealed, humidity-controlled storage. Electronics stored at 30–60% relative humidity in sealed containers with desiccant; the failure mode is corrosion of gold and tin contacts, which is invisible until the component is powered and intermittent.
- Temperature band. 15–30°C storage; the enemy is condensation from thermal cycling, not the absolute temperature.
- ESD protection. Every board and module in anti-static packaging, with the packaging labeled — an ESD-damaged flight controller can pass bench testing and fail on the aircraft under vibration.
- Rotation. A documented rotation policy that cycles shelf stock through the aircraft so nothing sits untouched for years — the obsolescence management guide makes the same point from the other direction, since long shelf life is precisely what makes a component's EOL status a surprise.
- Battery exclusion. Batteries stored separately from electronics, in fire-rated containment, per the section above.
The preservation spec belongs in writing at procurement time because it determines the kit's effective shelf life. A flight controller that has spent 18 months in a humid coastal warehouse is not the same asset as one that has spent 18 months in a sealed, desiccated case — and the difference only appears at the worst possible moment.
 Concept illustration
Total cost of ownership: the model that justifies the spares budget
The finance conversation about spares usually starts with "how much inventory do we need to buy", and it is the wrong question. The right question is what the aircraft costs per flight hour when it is available, versus what downtime costs when it is not. The TCO model has four lines:
1. Acquisition. The aircraft purchase price, amortized over its planned service life in flight hours. A $15,000 aircraft flown 1,500 hours over 5 years costs $10 per flight hour before anything else.
2. Consumables. Propellers, batteries and small parts, driven by the consumption rates above. For a heavy inspection aircraft this line typically runs 15–30% of the acquisition-per-hour figure.
3. Maintenance and repair. The labor and parts from the repairable pipeline, including the repair-vs-replace decisions and the freight. The electronics manufacturing quality guide is the reference for what quality programs do to this line — the difference between a supplier whose boards survive the vibration envelope and one whose boards come back in warranty claims is the difference between a predictable and an unpredictable maintenance budget.
4. Downtime. The cost of the mission that did not happen. For an inspection program with a booked schedule, this is contract revenue or compliance exposure; for a research program, it is the cost of the team standing idle. This is the line that the spares kit attacks directly — every dollar of spares inventory is a hedge against a specific, quantified downtime event.
The model's output is the spares investment level: the inventory quantity at which the marginal cost of another spare equals the marginal reduction in expected downtime cost. That is the number that survives a finance review, because it is built from failure rates, lead times and availability targets rather than from anxiety. For a single-aircraft program the calculation usually lands at an initial spares investment of 8–15% of aircraft value, but the honest answer is whatever the equation produces for that mission profile.
The lifecycle procurement checklist: 10 line items for the RFQ
The following checklist converts the planning framework into RFQ-ready line items. It applies to a first aircraft, a fleet expansion, or a reorder cycle, and each item names the evidence the supplier should provide.
1. Reliability data. MTBF or failure-rate data per subsystem, with the test conditions stated. Verification: the datasheets and the environmental derating notes.
2. Spares price list with the initial build. Spares quoted at the same terms as the aircraft, not at post-sale retail. Verification: the quotation line items against the aircraft BOM.
3. Firmware and configuration lock. Spare flight controllers, ESCs and radios delivered with the same firmware versions and configuration as the aircraft fleet. Verification: the version matrix in the delivery documents.
4. Repair scope and turnaround. The repair scope (board/module/factory), the turnaround commitment in weeks, and the repair-vs-replace cost threshold. Verification: the repair terms in the agreement.
5. Repairability documentation. Schematics or service-level documentation for the components the supplier will allow field repair on, and the calibration requirements after repair. Verification: the documentation package.
6. Consumable consumption data. Expected consumption rates for propellers, batteries and wear items at the planned utilization. Verification: the supplier's field data or the test program results.
7. Battery policy. Cycle-life rating at the operating depth of discharge, storage-voltage guidance, and retirement criteria. Verification: the battery datasheet and the storage documentation.
8. Storage and preservation requirements. The environmental conditions the spares must be kept in to preserve their rated life, and any time limits on shelf life. Verification: the preservation specification.
9. Availability commitment. The supplier's commitment to keep the platform's line items available for a defined period (typically 5–10 years after the last aircraft delivery), which is the bridge to the obsolescence management process.
10. Initial spares kit proposal. The supplier's recommended initial kit for the stated mission profile and utilization, with the sizing logic (failure rates, lead times, availability target) shown. Verification: the kit proposal against the planning equation in this guide.
The spares plan closes the loop with the rest of the program documentation: the supplier evaluation checklist for vendor selection, the fleet management infrastructure for consumption data, and the safety and redundancy design for the failure rates the plan is built on.
Explore custom engineering Back to Blog
Continue Reading

UAV Component Obsolescence Management
What happens when a component is discontinued — the EOL risk scoring, lifetime buys and form-fit-function qualification that run alongside the spares plan.
UAV Battery and Power Management
LiPo vs Li-Ion chemistry, cycle life and storage-voltage discipline — the cell-level data behind the battery lifecycle policy.

UAV Fleet Management Components
The telemetry, tracking and maintenance-logging infrastructure that produces the consumption data spares planning depends on.

UAV Propulsion Testing & Validation
The bench-test programs that catch infant-mortality failures before the aircraft ships — the reliability data the spares equation needs.

How to Evaluate a UAV Component Supplier
The vendor capabilities — test programs, traceability, availability commitments — that make a spares plan executable.