
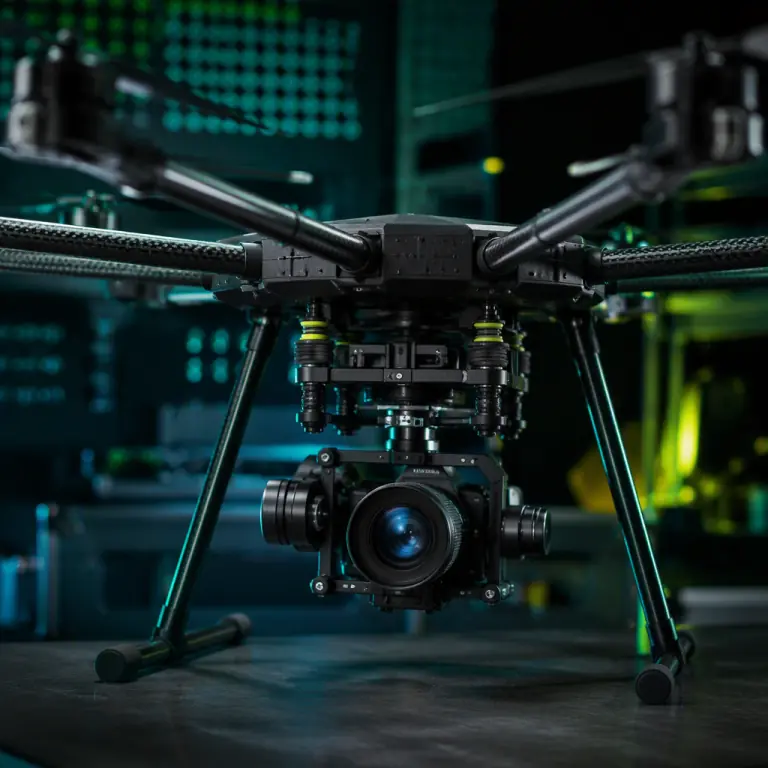
Every UAV integrator eventually meets the same symptom: a survey aircraft returns home with subtly blurred imagery, a gimbal that held perfectly on the bench hunts in the air, or a flight log showing accelerometer variance creeping up until the estimator stops trusting the IMU. The parts are all new, the wiring is clean, and the aircraft flies “fine” by feel. Vibration is the classic silent failure because it is invisible in hover on a bench and only shows up as degraded data or shortened component life in the field. The engineering response has three levers, and they must be pulled in order: remove the vibration at the source (balancing and matching rotating parts), stiffen the path (airframe structure), and only then isolate the receiver (mounts, damping and filtering). This guide is about the third lever. The isolation hardware itself, the physics that sizes it, and the specification language that makes it purchasable. The propeller balancing and vibration analysis guide covers the first lever in depth; here the assumption is that the source is already as clean as it will get, and the remaining vibration still exceeds what the payload can tolerate.
What the vibration spectrum actually looks like on a UAV
Isolation decisions are frequency decisions, so the first step is knowing what the aircraft actually emits. The dominant mechanical energy sits at a small set of discrete frequencies, not in a broadband hum. The largest line is rotor 1P, once per revolution of the propeller, caused by residual imbalance and aerodynamic asymmetry. Its frequency is simply motor RPM divided by 60, which is why it changes with throttle and why hover is usually the worst case for a multirotor: the aircraft sits at the RPM where it must produce full static thrust. A small multirotor typically hovers at 5,000-8,000 RPM, putting 1P between roughly 83 and 133 Hz; an industrial hexacopter or octocopter turning 2,800-4,500 RPM produces a 1P line at 47-75 Hz; a fixed-wing aircraft cruising at 6,000-9,000 RPM shakes at 100-150 Hz. Above 1P sits blade-pass frequency at two or three times 1P (one per blade), then motor cogging and pole-pass frequencies in the hundreds of hertz to low kilohertz, which are mostly structure-borne buzz. The ESC switching frequency is far higher, kilohertz to tens of kilohertz, and is an electrical and radiated problem, not a mechanical one.
| Source | Typical frequency band | Character | Where it does damage |
|---|---|---|---|
| Rotor 1P imbalance | 45-150 Hz (hover RPM by aircraft class) | Once-per-rev sine; grows with imbalance and RPM | Whole airframe; worst when it hits a resonance |
| Blade-pass aero | 2-3x rotor 1P (100-450 Hz) | Steady tonal; stronger on multi-blade props and at tip speeds near transonic | Cameras, gimbals and anything with mechanical compliance |
| Motor cogging / pole-pass | Hundreds of Hz to low kHz | High-frequency buzz from magnetic slot ripple | Structure-borne noise; can alias into IMU samples |
| ESC switching | kHz range | Electrical, not mechanical | Wiring and EMI, outside isolator scope |
| Airframe resonance modes | Roughly 30-150 Hz | Amplification at mode frequencies (5-20x typical) | Arm tips, center plates, payload hardpoints |
| Gusts and maneuvering | Below 10 Hz | Low-frequency attitude motion | Gimbals and imagery; passive isolators cannot fix it |
Two consequences follow. First, a source line that lands on an airframe resonance stops being an annoyance and becomes a multiplier: the same motor can produce five to twenty times more motion at a resonant hardpoint than at a node, which is why two visually identical airframes with different internal damping can have completely different payload vibration. Second, most of the damaging energy for cameras and avionics is concentrated in the 45-450 Hz band. Which is exactly the band where passive isolators operate, and where the mounting design, not the part count, decides the outcome.
Natural frequency, transmissibility and the root-2 rule
An isolator is a spring between the vibrating structure and the sensitive receiver. Every spring–mass system has a natural frequency where it resonates, and the entire behavior of a passive mount is described by how the disturbance frequency compares to that natural frequency. For a payload of mass m on a mount of stiffness k, the natural frequency is fn = (1/2π)√(k/m). But the practically useful form is the static-deflection shortcut: a mount that deflects d millimeters under the payload weight has fn ≈ 15.8/√d Hz. One millimeter of static deflection gives roughly 15.8 Hz; a soft mount that settles 3 mm sits near 9 Hz; a stiff 0.2 mm deflection pushes the natural frequency toward 35 Hz. This is why a mount cannot be evaluated on a shelf. The same elastomer part has a different natural frequency under a 200 g camera than under a 2 kg LiDAR.
The transmissibility curve then decides everything. Below the natural frequency the mount transmits motion essentially 1:1 and does nothing useful. At the natural frequency it amplifies. By a factor of roughly 1/(2ζ) for a damping ratio ζ, which is why an undamped mount at resonance can multiply vibration rather than reduce it. Isolation only begins above √2 × fn (≈1.41), and it improves steeply after that: at twice the natural frequency the transmitted motion is about one third (−10 dB), at three times about one eighth (−18 dB), at four times roughly one sixteenth (−24 dB). The design rule that falls out of this curve is simple: to isolate a disturbance at frequency f, choose a mount whose loaded natural frequency is no higher than f/2.5 to f/3, and preferably lower. A gimbal sitting on a 30 Hz mount will see almost no isolation from a 47 Hz rotor line; the same payload on a 15 Hz mount is attenuated by roughly 15-20 dB at that frequency.
Damping complicates the picture exactly where engineers expect it to help. Adding damping lowers the resonance peak, valuable during spool-up, landings and any transient that sweeps through the natural frequency, but above resonance, damping degrades the isolation that the spring alone would provide. A lightly damped mount (5-10% damping) that gives −20 dB at high frequency may deliver only −10 dB with heavy damping added. The correct answer for an aircraft is usually moderate damping plus a natural frequency far enough below the persistent disturbance lines that the resonance is never excited in cruise, rather than maximum damping on a mount that sits too close to 1P.
Isolator families: elastomer, wire-rope, laminate and air
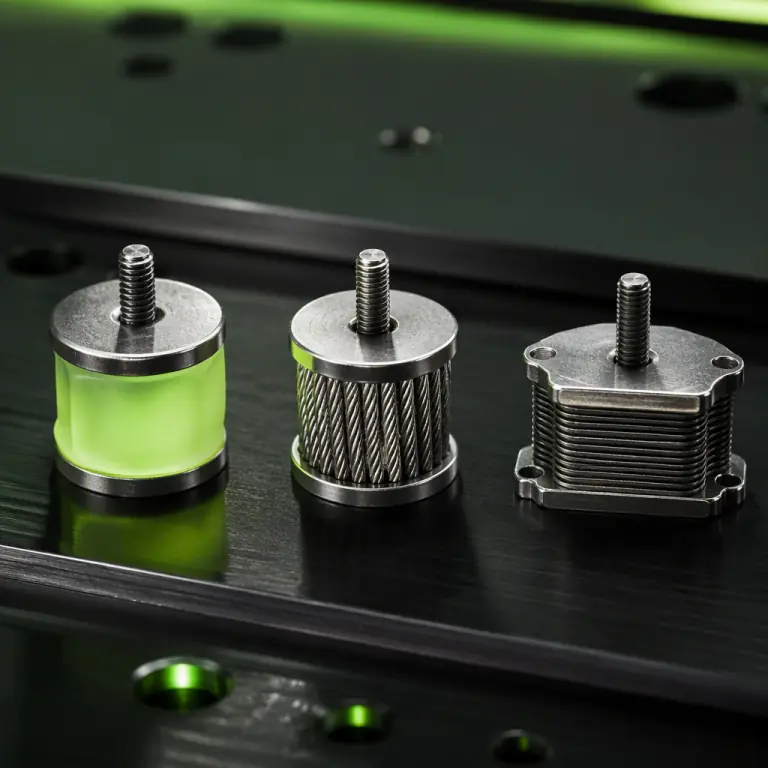
The UAV integrator has four practical mount families, and each occupies a different point on the stiffness, damping, weight and environmental axes. Elastomer mounts, silicone, neoprene or EPDM cylinders and shear pads, are the default for cameras and small payloads: they are light, cheap and can reach loaded natural frequencies of 15-45 Hz, but their stiffness changes with temperature, they creep under sustained load, and they harden or soften dramatically outside their rated range. Wire-rope isolators, made from stainless steel cable wound between two plates, provide the highest damping (20-40%) and tolerate large deflections, wide temperatures, salt and even crash loads, with loaded natural frequencies as low as 8-20 Hz, at the price of weight and a less clean high-frequency roll-off. Laminate sandwich mounts, thin elastomer bonded between metal plates, are the avionics-tray workhorse at 25-60 Hz: compact, stiff enough to hold a stack of boards, and sized for the lighter loads of electronics rather than optics. Air springs reach natural frequencies below 5 Hz but need a sealed volume and pressure source, which makes them a ground-station and heavy-platform technology rather than an airborne one.
| Family | Practical fn range | Damping | Best for | Watch-outs |
|---|---|---|---|---|
| Elastomer (silicone, neoprene, EPDM) | 15-45 Hz loaded | 5-15% | Cameras, small payloads, gimbals | Creep, temperature stiffening, compression set |
| Wire-rope (stainless cable) | 8-20 Hz loaded | 20-40% | Heavy payloads, crash-prone and harsh-environment ops | Weight, cost, less roll-off at high frequency |
| Laminate sandwich (elastomer + metal) | 25-60 Hz loaded | 10-20% | Avionics trays, flight-controller decks, PDBs | Limited low-frequency isolation by design |
| Air / pneumatic | 3-8 Hz | Low (needs auxiliary damping) | Ground stations, transport cases, very heavy stabilized payloads | Sealed volume, pressure source, weight, rarely airborne |
Material choice inside the elastomer family matters as much as geometry. Silicone keeps its stiffness over the widest temperature range and is the usual recommendation for outdoor UAVs that fly from −20 °C to +50 °C; natural rubber and neoprene stiffen sharply in the cold and soften in heat, and some formulations are attacked by fuel, oil and ozone. For optics-grade payloads, ask about outgassing and compression set, and always specify the mount by its loaded natural frequency at the actual payload mass. Not by its unloaded shore hardness, which tells you almost nothing about how it will behave under your payload.
 Elastomer, wire-rope and laminate mounts
Flight controllers: the isolation question is really a filtering question
Of every receiver on the aircraft, the flight controller is the one where naive isolation does the most harm. The IMU’s accelerometers and gyros cannot distinguish vibration from motion, both are just acceleration, and the autopilot’s estimator spends a portion of its trust budget on whatever the sensors report. Autopilot guides and log-analysis tools consistently treat broadband vibration above roughly 3 g (about 30 m/s²) at the IMU as a problem to fix, because it inflates the accelerometer variance that the filter uses to weight its measurements. But the correct remedy hierarchy starts upstream: balance the propellers, confirm the motor and propeller are matched (imbalance at speed is often a matching problem), stiffen the mounting deck, and then use the autopilot’s own notch filters to kill the discrete 1P and blade-pass lines in software. The PID tuning guide covers how those filters are set from the vibration log; the sensor fusion guide explains what the estimator does with the cleaned signal.
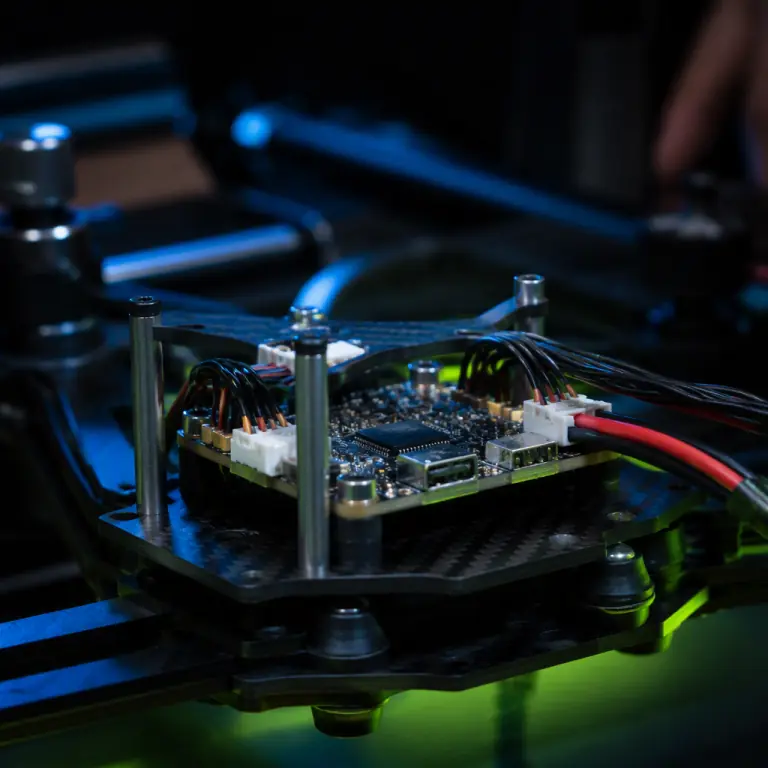
Soft-mounting the flight controller itself is the classic mistake. A compliant mount under the FC turns the control loop’s own corrections into low-frequency rocking, introduces phase lag that no filter can remove, and behaves differently after every hard landing as the foam or elastomer takes a set. Modern practice on industrial UAVs is a rigid, well-supported flight-controller mount on a stiff deck, with propeller balancing and notch filtering doing the vibration work. Which is exactly why the most reliable aircraft in the field are usually the ones with the fewest soft parts under the autopilot. Small stack-style controllers with integrated foam are acceptable only when the foam is captured so it cannot rock or shift, and the vibration is verified in flight logs rather than assumed away.
 Rigid flight-controller mount
Cameras, gimbals and LiDAR: where passive isolation genuinely pays
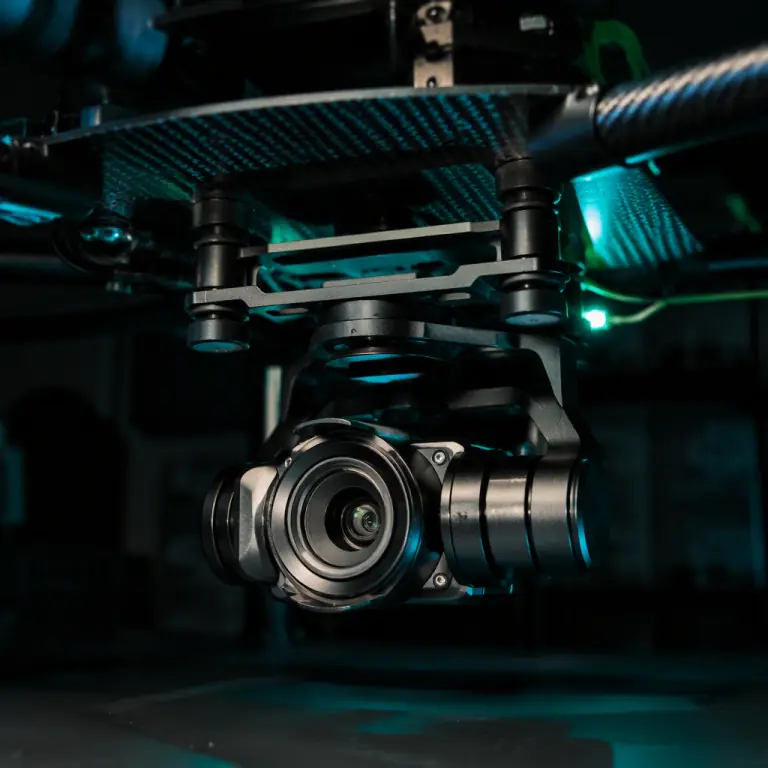
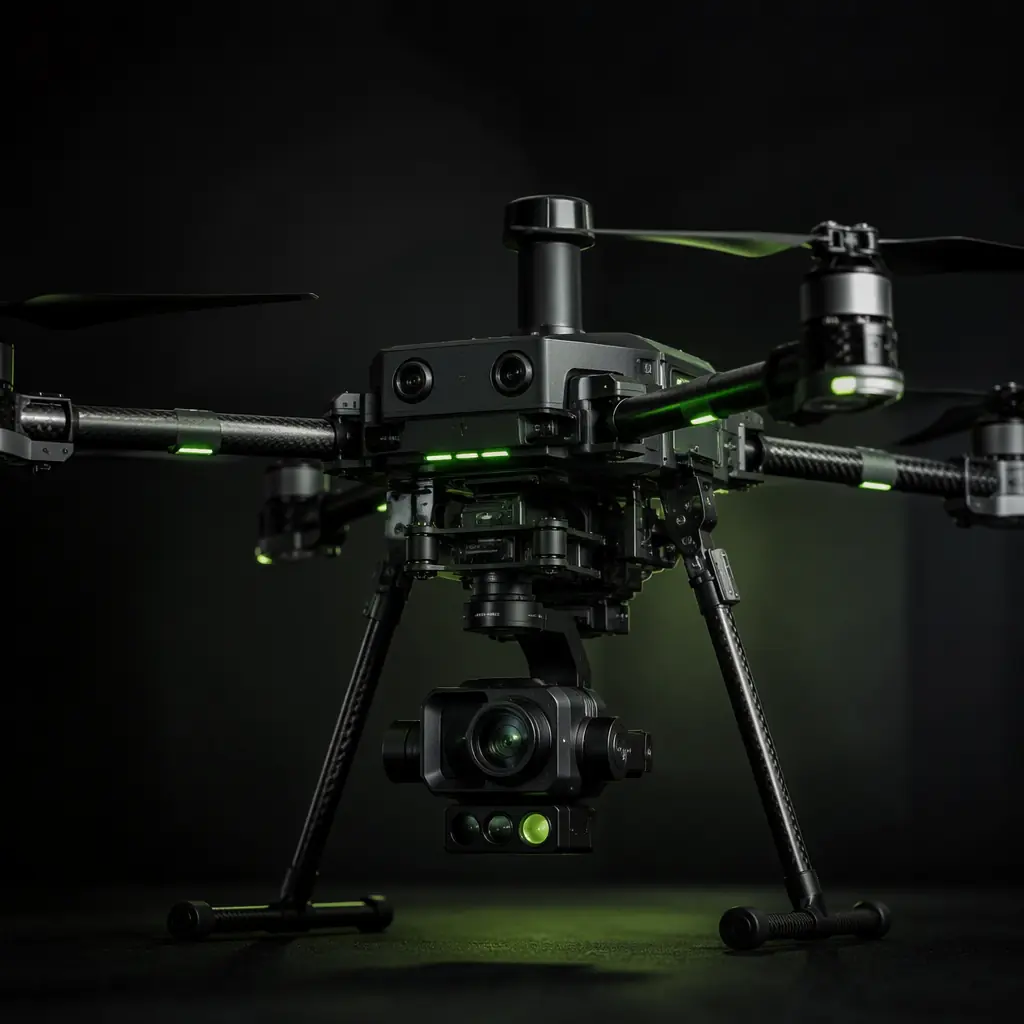
The payload is where isolation earns its keep, because optical and ranging systems integrate vibration over time. A gimbal is itself an active isolator, its internal IMU and motors reject disturbance up to its control bandwidth, which is why high-end gimbals hold sub-0.05° pointing in steady flight, but its correction loop has finite authority. High-frequency jitter above that bandwidth, and sharp transients from rotor 1P on a resonant hardpoint, make the gimbal motors work harder, draw more current and occasionally lose the shot. A passive isolator between the airframe and the gimbal mount removes exactly that high-frequency residue, letting the gimbal spend its authority on genuine aircraft motion. The camera and gimbal selection guide details the payload side of this equation.
For fixed mapping cameras the budget is simple pixel smear. A 50 mm lens on a sensor with 3.9 µm pixels projects about 12,800 pixels per radian of angular motion, so a sustained 2°/s angular rate during a 1/1000 s exposure moves the image roughly one pixel. And one pixel of smear is already too much for photogrammetry at survey margins. Keeping angular rates below roughly 1°/s during exposure, or shortening the exposure and adding forward-motion compensation, is the working rule for sub-pixel sharpness, and a correctly sized isolator is what keeps those rates inside budget in turbulent or high-throttle flight. The same logic applies to LiDAR payloads . Vibration broadens the return footprint and degrades edge detection on spinning scanners, and to radiometric thermal cameras, where a vibrating platform blurs the image and corrupts the per-pixel temperature measurement that an inspection report will be built on.
Sizing follows the root-2 rule from earlier: measure or estimate the lowest persistent disturbance line (usually rotor 1P at hover), and select a mount whose loaded natural frequency is at or below one third of that frequency, a 50 Hz hover line calls for a mount near 15 Hz or lower. Distribute the payload across four mounts symmetrically so the payload does not rock on a cantilever pendulum mode, check the static deflection at the real payload mass, and verify that the mount is stable under the thrust transients of a hard climb or a landing impact, where the payload briefly experiences several g. The payload integration guide covers the mechanical layout rules, weight, center of gravity and mounting patterns, that a four-point isolator arrangement has to respect.
 Gimbal on four-point isolators
Avionics trays and payload computers: fatigue, fretting and the laminate mount
Electronics fail from vibration on a different timescale than optics, which makes the damage easy to miss until it is expensive. Solder joints under cyclic bending stress accumulate fatigue damage, the failure mode that vibration screening in MIL-STD-810H Method 514 and DO-160G Section 8 is designed to expose, and the heavy components on a payload computer (inductors, heatsinks, connectors, NVMe drives) act as masses that lever their own solder joints and sockets. Connector contacts suffer fretting corrosion from micro-motion measured in microns, which slowly oxides the interface and produces intermittent failures that only appear in flight logs. Board-level failures rarely announce themselves; they show up as a crashed companion computer on flight 200. The electronics manufacturing quality guide explains the joint-quality side, and the connectors and wiring guide covers the contact-level risks; the mechanical answer on the tray is a laminate-sandwich isolator set with a loaded natural frequency of 25-50 Hz, which protects the boards without letting the whole tray rock under maneuvering loads.
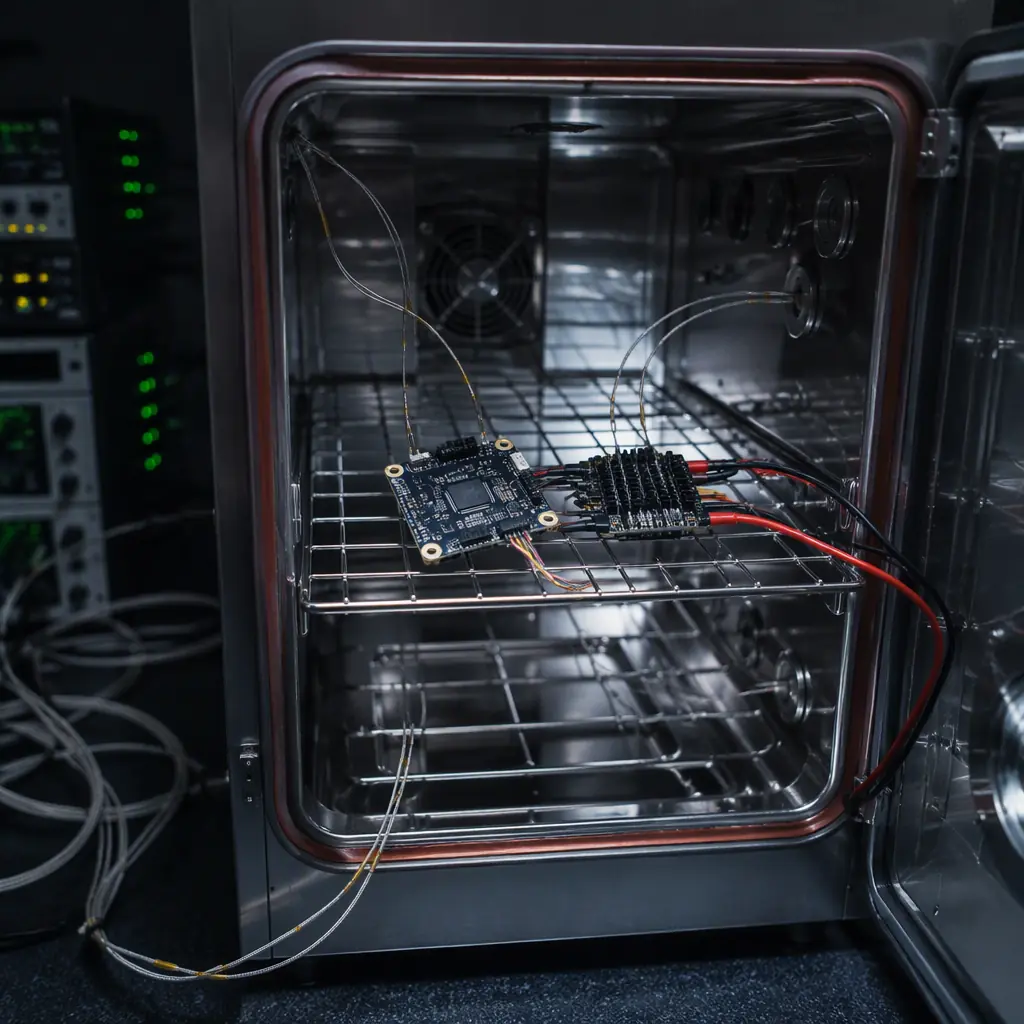
Two additional rules apply inside an isolated avionics bay. First, isolate the tray as a whole rather than individual boards. A stiff internal frame on four laminate mounts gives every board the same motion and avoids inter-board resonance. Second, remember that anything spanning the isolation boundary, wiring bundles, antenna cables, standoffs that touch both the tray and the airframe, short-circuits the mount and can re-route the vibration straight into the electronics. Leave service loops of cable at the boundary and verify that no rigid element crosses from the vibrating structure to the isolated mass. If the mission profile includes formal qualification, the environmental qualification testing guide shows how MIL-STD-810 and DO-160 vibration profiles are specified and how to read the resulting test report.
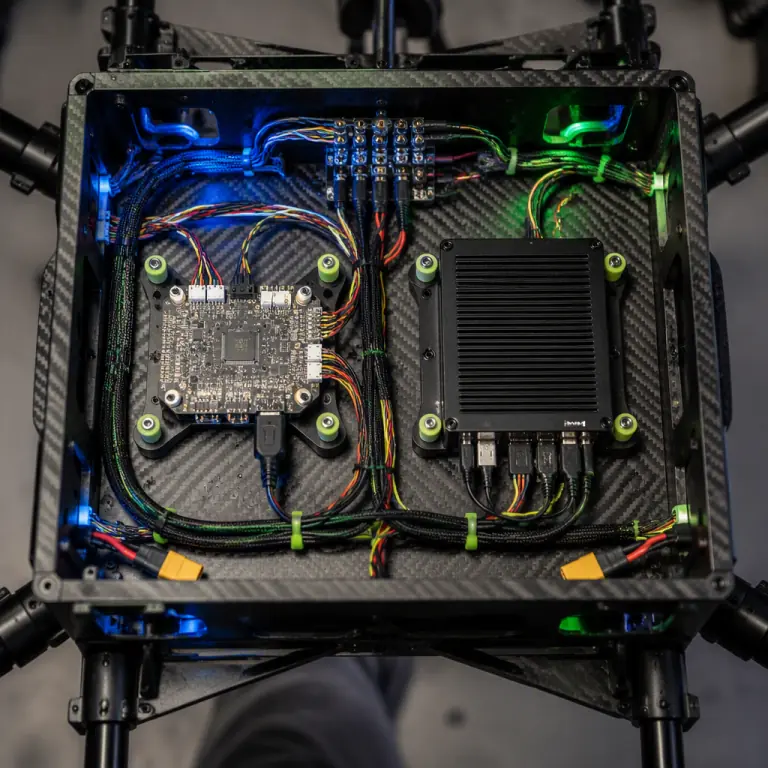 Isolated avionics tray
Sizing and specifying an isolator: the workflow and RFQ checklist
The repeatable sequence for any isolation problem is: (1) identify the persistent disturbance frequencies from flight logs or from motor RPM at hover and cruise; (2) set the receiver’s vibration budget. Pixel smear for a camera, pointing error for a gimbal, g-level for the IMU; (3) choose a target loaded natural frequency at or below one third of the lowest persistent line; (4) divide the payload mass across the mount points and compute the static deflection each mount must allow; (5) select the family and elastomer for the operating environment and crash exposure; (6) confirm the mount has no rigid load path and that cables at the boundary have service loops; (7) ask the supplier for measured transmissibility data, not just a shore hardness; and (8) verify on the aircraft with a hover-to-full-throttle accelerometer log before and after the change. That last step is the one that separates a real fix from a parts swap: the difference between two mounts is a number in the log, and the pre-shipment inspection guide shows how to make such acceptance data a contractual deliverable rather than a hope.
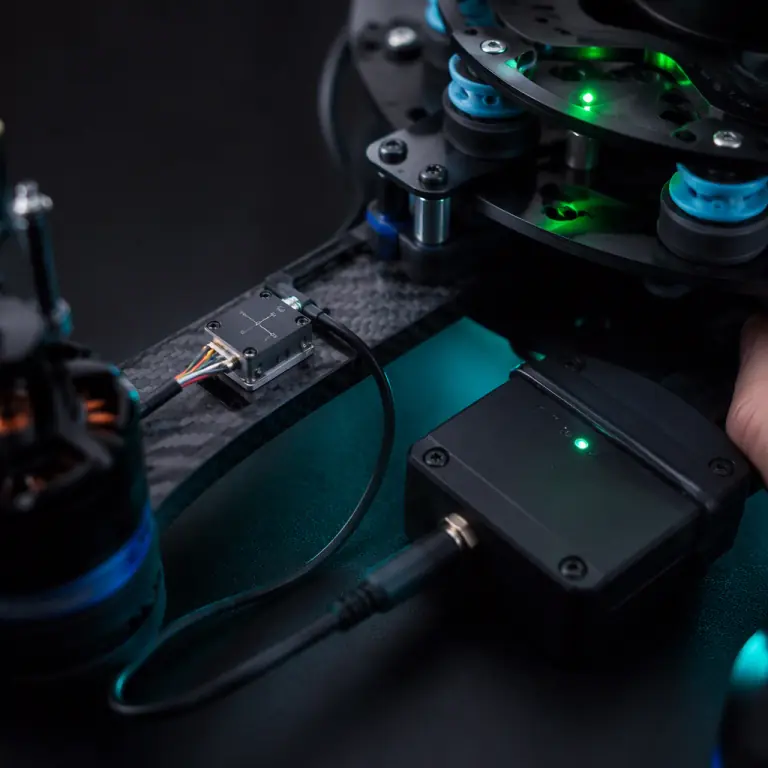 Before-and-after vibration log
When the isolator goes onto an RFQ, the line items that prevent a useless purchase are concrete: load rating per mount at the operating deflection; static deflection at that load; loaded natural frequency with tolerance (e.g. 15 Hz ±2 Hz at 600 g); damping ratio; transmissibility at 2× and 4× the natural frequency or a full curve; operating temperature range and elastomer type; compression set and creep limits; dimensions, thread size and fixing pattern; weight; and a resonance-search or transmissibility test report from an actual sample. Suppliers who cannot state a loaded natural frequency for your payload mass are selling rubber, not isolation, the RFP writing guide explains how to structure those requirements into an enforceable specification.
The bottom line: vibration isolation on a UAV is a frequency problem with a well-understood solution. Remove the source energy first, keep the structure stiff, then place a mount whose loaded natural frequency sits well below the persistent disturbance lines, with enough damping to survive transients and the right material for the environment. Applied that way, a few dollars of correctly selected elastomer protects thousands of dollars of payload and turns a log full of accelerometer variance into imagery and data you can defend. EMS Drone specifies and supplies isolation hardware as part of every payload integration, gimbal mounts, camera decks, LiDAR platforms and avionics trays sized from your actual mass and flight logs, with before-and-after vibration measurement on the bench and in the air. Send us your airframe, payload mass and a flight log, and we will return the mount specification, the four-point layout and the acceptance test plan.
Continue Reading
Propeller Balancing
Removing vibration at the source: balance grades, rigs and field procedure.
Camera & Gimbal Selection
Sensor, lens and stabilization choices for imagery that survives flight.
Payload Integration
Mechanical and electrical rules for mounting sensors, gimbals and releases.
Env. Qualification Testing
MIL-STD-810 and DO-160 vibration profiles and how to read test reports.